Free Balanced Scorecard Templates for Excel and PowerPoint
One of the most frequently used frameworks in organizational management, a balanced scorecard (BSC) communicates what a company has set out to achieve and how it plans to do it. To yield the best results, it needs to clearly show how an enterprise’s high-level strategic goals, initiatives and success metrics evolve and are connected to its mission, vision and core values. Specific tools have been designed to help you achieve this goal and they typically include a one-page graphic or template that links the main elements of a strategy to priorities, key performance indicators, and timeframes for implementation.
Below, you can find three of the most common types of scorecard templates that you can use to outline and develop your strategic plans, available in two versions:
- a scorecard template for Microsoft Excel, which is suitable for the manual creation of your BSC;
- a scorecard template for Microsoft PowerPoint that helps you build visually appealing balanced scorecards when used with the Office Timeline Pro add-in, an intuitive timeline maker.
Top 3 Free Scorecard Templates
Here are three scorecard templates examples that can help you save time and get ready quickly for that important top management meeting:
You can download them for free and modify them with just a few clicks to create a stylish project visual that will impress your clients and executives.
1. Basic Balanced Scorecard Template
The traditional balanced scorecard model focuses on four overarching components to provide companies with a comprehensive perspective of their health and performance. These components are financial sustainability, customer experience, internal processes and workforce culture, learning and growth. By breaking down a large-scale vision into actionable and measurable categories and activities, a basic scorecard helps you visualize how an organization’s high-level strategy impacts day-to-day operations and their external outcomes.
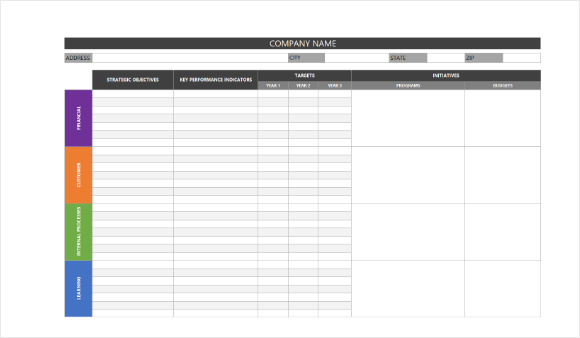
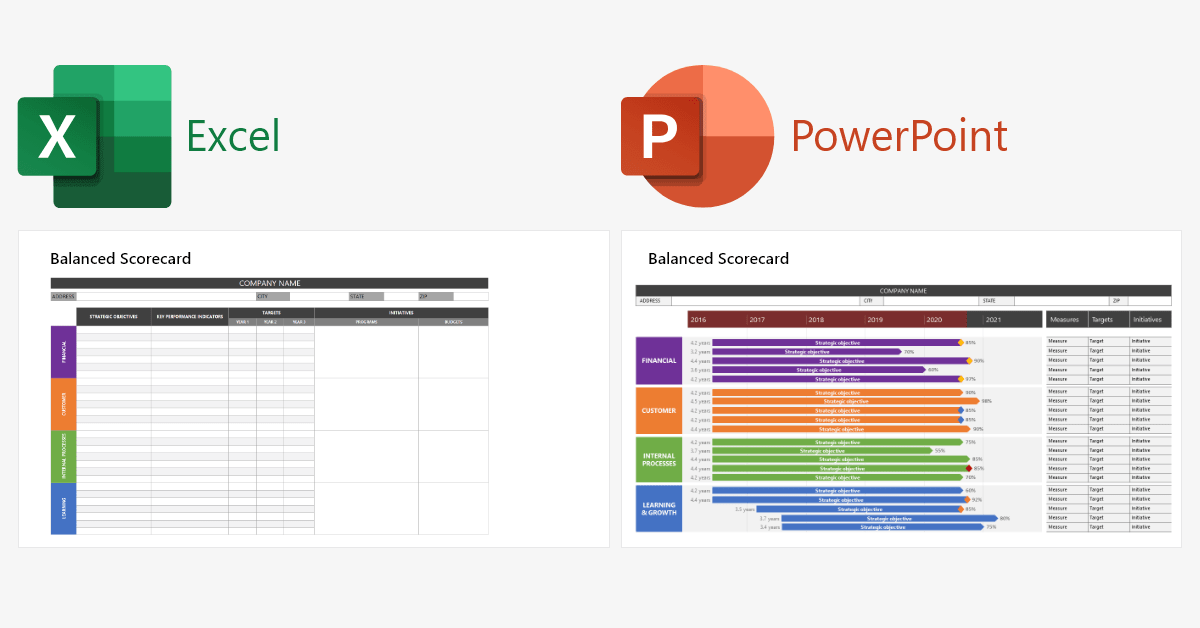
Your basic scorecard template lets you enter and structure key information such as objectives, KPIs, targets and initiatives for each of the perspectives mentioned above.
To enjoy a quick start in creating your first basic scorecard, here are two professional, pre-designed templates that can be quickly customized in Excel or PowerPoint (using the Office Timeline Pro add-in).
The Microsoft Excel template gives you an easy-to-read layout that you populate simply by entering your data. The PowerPoint one allows you to map out the strategic objectives against a timeband, add milestones, drag&drop elements and change colors, fonts on what is going to be a presentation-ready graphic which can be turned into a picture as well.
2. Strategy Map Scorecard Template
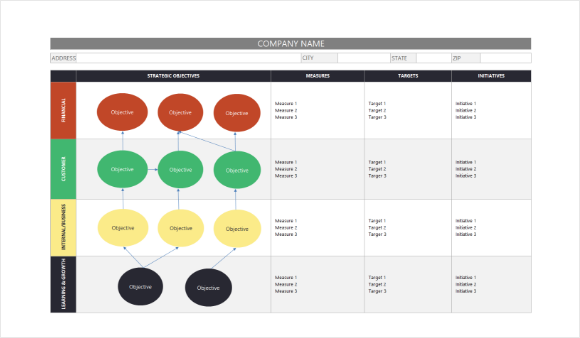
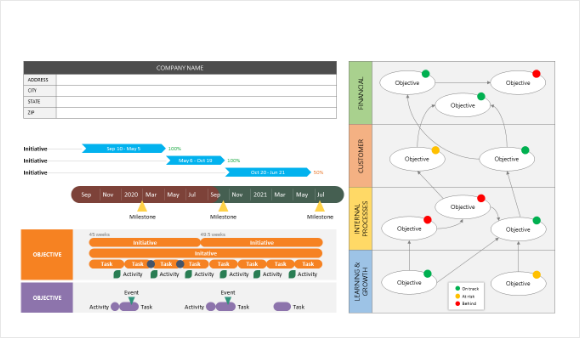
A supporting element of a balanced scorecard, the strategy map reveals an organization’s strategy and performance at one glance by illustrating the cause-effect relationship between all its strategic objectives. When done properly, this one-page diagram quickly communicates the big picture to everyone in the company and helps people understand where they fit in it.
A well-designed strategy map groups the most relevant strategic objectives into the four perspectives described earlier and includes arrows to show the cause and effect chain. By following the path created through arrows, one can see how smaller objectives and initiatives drive and influence the success of higher ones. It can also help if you add a timeline and Gantt chart to the presentation so that you and your stakeholders get aligned and agree on a timeframe.
Use the templates below to clearly reflect the causal relationship between your objectives and effectively tell your organization’s strategic story.
3. KPI Scorecard Template
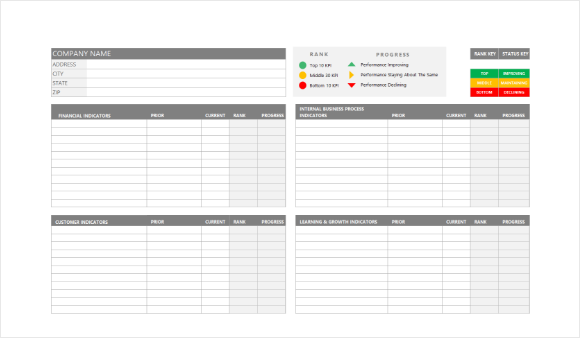
Used to measure progress or achievement towards a set of key performance indicators, a KPI scorecard gives managers and decision-makers an in-depth insight into how to act next in order to increase productivity and decrease costs.
Specific to each company’s strategy, KPIs are unique measures which help determine whether you are meeting your goals or not. However, based on the field or industry in which a business operates, there are standard sets of such success metrics. Here are are a few examples for each of the four perspectives considered within a balanced scorecard:
- Financial: income, revenue growth, return on investment, profit;
- Customer: customer retention, NPS (Net Promoter Score), conversion rate, average resolution time;
- Business/Internal processes: time to onboard a new hire, percentage of paperless or self-service processes, cost measure for storage, order fulfilment time;
- Learning and growth: training completion percentage rate, job role competency rate, compliance percentage rate etc.
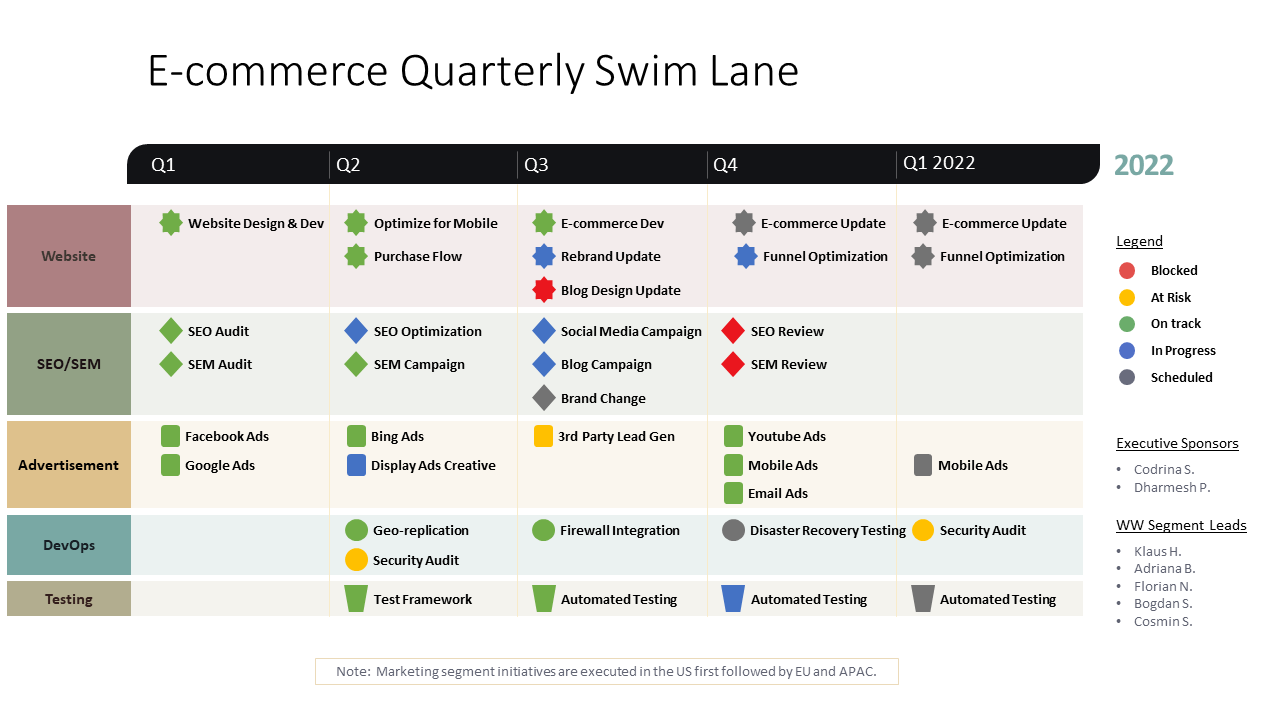
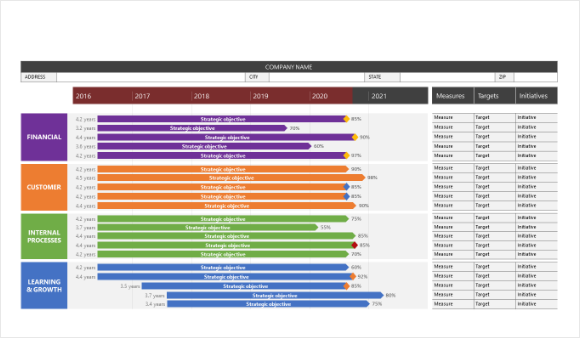
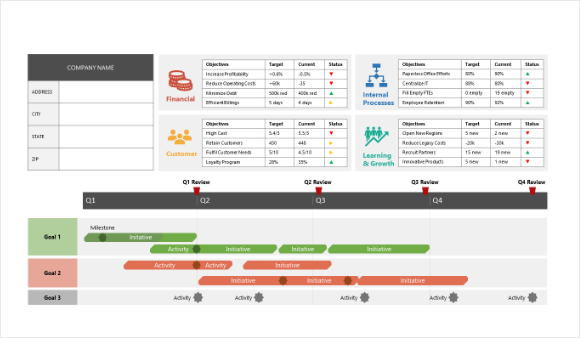
The KPI scorecard templates below help you define and centralize all your performance metrics in one place. Both of them are editable to reflect your needs, and include space where you can add company logos, as well as details about how each of your KPIs is doing. The PowerPoint template also includes a swimlane diagram timeline that helps you visualize the most important activities and achieve your goals.
Discover more tools to help you effectively develop and track your BSC on our section dedicated to balanced scorecard software.
Make a scorecard to remember
Use your PowerPoint controls and our timeline automation tool to create amazing project visuals that get your point across.
