The pharmaceutical industry has the opportunity to sustain the momentum of change and innovation initiated by the fight against the coronavirus pandemic and establish new ways of working for the future through the adoption of advanced digital technologies, comprehensive regulatory frameworks, and powerful cross-industry collaborations.
Yet we mustn’t forget that change starts at the micro level, with each project and team of clinical scientists and senior management working on developing and producing safe and effective medical treatments as soon as possible. Above all, change starts with clarity. And nothing provides a complete overview of project activities and milestones like a well-made project visual.
To help you better understand the benefits of turning project plans into big-picture visuals, we’ve included 4 examples of Gantt charts, timelines, and roadmaps that can help project managers in the pharmaceutical industry manage the lengthy product development process and potential changes that might appear. You can download any of these PowerPoint slides for free and customize them as you wish using the Office Timeline free trial.
1. Clinical trials Gantt chart
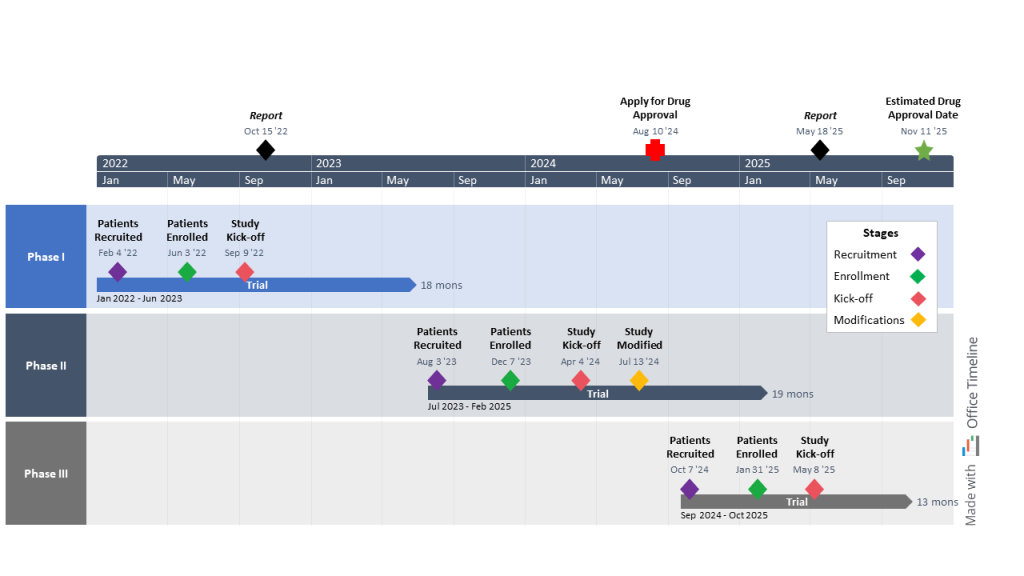
As a product manager at a large U.S. pharma company, Anna’s been tasked with overseeing the development of a new cutting-edge drug that could improve the lives of millions of patients worldwide if launched on the market.
The new drug candidate has currently reached the clinical trial stage, meaning that a series of tests is set to evaluate and confirm its safety, efficacy, and dosage levels in patients afflicted with the disease in question.
Thus, Anna’s responsible for putting together and managing the timeline for the drug trials and ensuring their completion follows the Food and Drug Administration (FDA) regulatory guidelines. To achieve such a crucial task, she requires a tool to help her create high-level timelines in one easy-to-read PowerPoint slide.
She’s trialed about five different apps before finding her favorite — the Office Timeline add-in. Simple, intuitive, and offering an entire collection of beautiful ready-to-use Gantt chart templates, the tool is just what Anna needed to present the three phases of clinical trials and key milestones to her stakeholders.
She creates an individual swimlane for each phase from patient recruitment and enrollment to study kick-off and potential modifications, where she marks the duration of the drug trial and the dates. Then, she uses the Style Pane to assign different colors to each stage and enhance the clarity of the visual.
Before Anna moves on to the rest of the visual, she creates a legend box with the help of the PowerPoint controls to break down the meaning behind each color. She also adds critical milestones directly on the timeband, which she customizes to show two timescales (years and months) and provide senior management with a clear visualization of both short- and long-term goals.
Thanks to this Gantt chart, Anna can more easily evaluate the progress of the trials, identify and solve issues before they turn into crises, and keep group meetings between the participants involved in the drug development process short and useful.
On top of that, the visual allows her to estimate the right time to submit the New Drug Application (NDA) for FDA approval, as well as the date when the drug could become available for mass production and distribution.
2. Medical devices regulations timeline
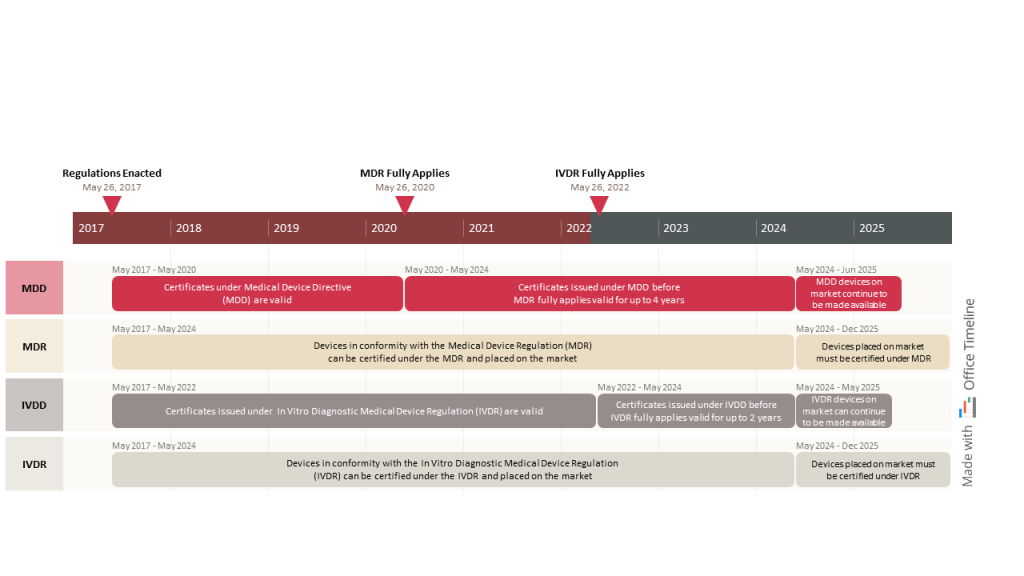
Philipp works as a PM at a pharma company headquartered in Germany, developing medical devices and in vitro diagnostic (IVD) technologies and selling them to patients and medical institutions worldwide.
These devices must comply with the new regulations imposed by the EU Parliament — the Medical Device Regulation (MDR) and the In Vitro Diagnostic Regulation (IVDR). Such guidelines were designed to make medical and IVD products safer and more reliable for the general public while requiring manufacturers to meet higher standards in terms of performance requirements, clinical evaluation, and technical documentation.
Ensuring compliance with regulatory bodies is not an easy task, and in Philipp’s case is not the only one. He also has to create status reports for upper management and maintain timelines like the one above that he made using Office Timeline.
It’s a simple yet effective timeline where each phase has its own swimlane and includes all the most significant events in the EU regulatory compliance legislation. Moreover, the tool is flexible enough to display a clear explanation of each stage in the transition from older regulatory requirements to newer ones. Philipp added important milestones on the timeband to mark the completion of crucial stages and illustrated the elapsed time using a strong color to anchor the visual in the present.
This timeline helps him keep track of upcoming dates when changes to the business practices or the technical documentation of medical and in-vitro diagnostic devices become mandatory.
3. Drug development project plan
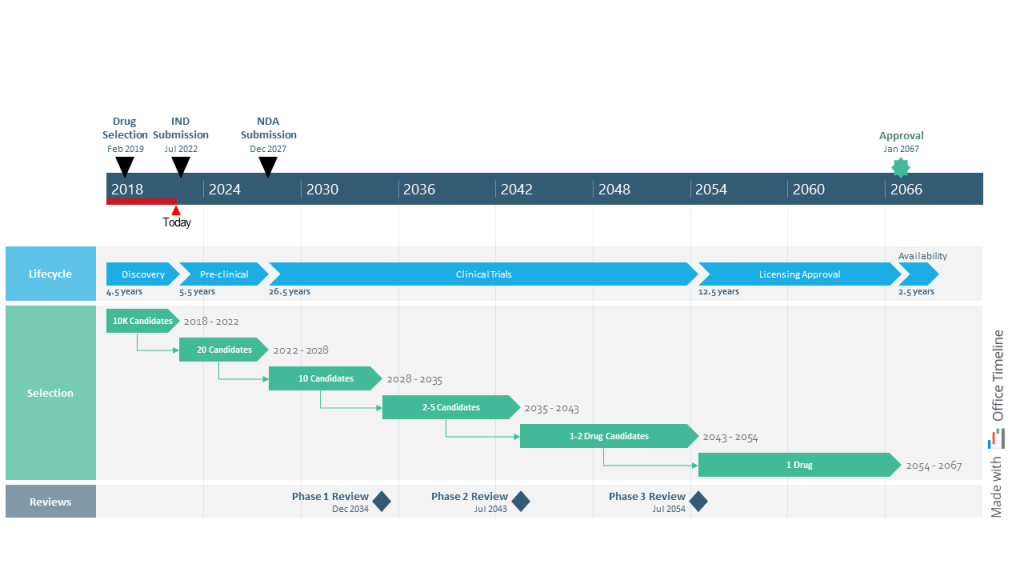
Lisa is a director in charge of exploratory research at a pharmaceutical company known for its innovative approach to the R&D process. Managing the numerous moving parts of the drug development process is a challenging task that she’s become accustomed to in her 15 years of experience in the pharma industry.
What she’s rather struggling with is turning the process of trials and approvals for end-to-end discovery, development, licensing, and production of new drug candidates into a concise, easy-to-follow roadmap for stakeholder meetings. Working with Microsoft Project’s features often takes Lisa several hours, only to end up with a clunky visual that’s hard to understand and a splitting headache.
Luckily, this time, she’s come across the Office Timeline tool via a Google search. She couldn’t believe how effortless it was to create a high-level roadmap spanning over 50 years and simplify the drug discovery journey for the entire management team. Plus, the visual looked amazing — it was the kind of project timeline that executives and senior management would enjoy paying attention to.
Lisa started building the roadmap by creating three colorful swimlanes, one for each type of process. Then she combined placing tasks in a row to show the sequential drug development lifecycle with adding tasks on separate rows and using PowerPoint’s connector lines to point out the consecutive steps in selecting drug candidates.
On the timescale, Lisa marked important events and their dates and also added the elapsed time and ‘Today’ marker to show current progress towards the end goal. With the finished roadmap in front of her, she felt more confident about the direction of the drug discovery program. Not to mention, Office Timeline saved her a lot of time with designing and formatting the visual.
Overall, the roadmap is a great tool for Lisa and her managers, helping them optimize the selection process for the most promising compounds and improve the rate at which new medical treatments enter the market.
4. International Pharma product launch timeline
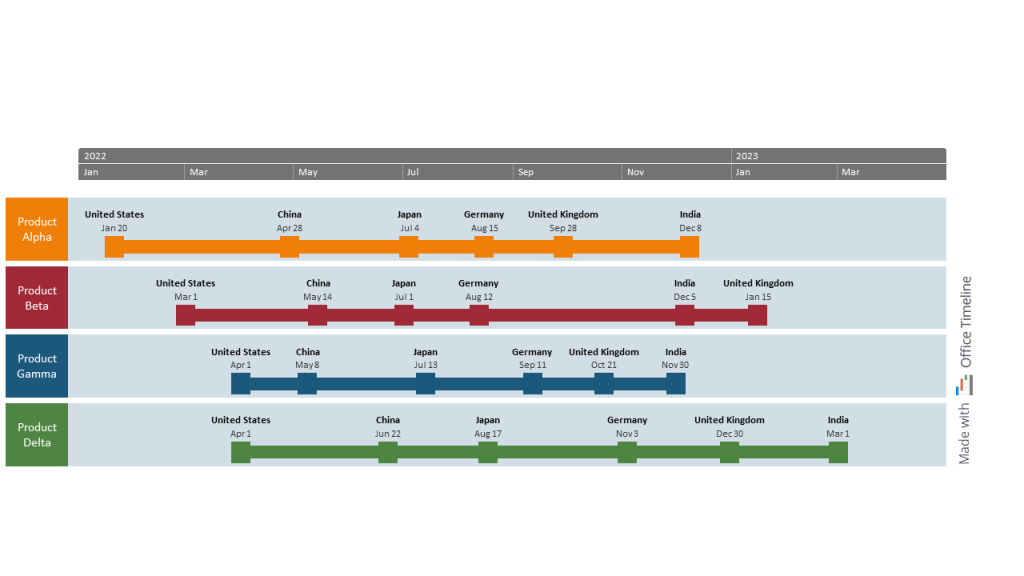
Carmen is a portfolio manager at an international pharma company. Her responsibilities focus on overseeing the go-to-market strategy for a range of related pharmaceutical products. Each drug has a different time of approval and competitive environment, so making sure that the product enters leading pharma markets at the right moment is essential.
To keep track of major project events across her portfolio, Carmen decided to build a timeline displaying the international product launch milestones over the next couple of years. Since her department uses Office Timeline to put together visuals for presentations, project meetings, and reporting, she’s already familiar with the tool’s versatility and intuitive interface.
The dates are seamlessly imported from an Excel file in seconds. Then, with a few clicks, Carmen places each milestone on separate task bands using the handy drag&drop editor in the Timeline View. Everything works so smoothly and quickly, very unlike her past experiences with other tools like Visio or Microsoft Project.
She divides the timeline into individual swimlanes for each drug, matching the launch dates with the corresponding product rows. When it comes to details, Carmen chooses to display only the country names and the dates for each milestone to keep things simple. Lastly, she applies a suitable color scheme to make the timelines stand out.
Carmen stands back, looking approvingly at her PPT slide — another presentation-ready timeline done in less time than it takes her to update a MS Project file. Now, she can show her stakeholders a high-level view of the launch process and better schedule preparation activities for the main launch events.
Plan for innovation and keep track of progress and key milestones with Office Timeline
Drug discovery and development projects, in particular, require careful planning, ongoing milestone tracking, and overall clarity of timelines and process stages spanning multiple years. These tasks can be successfully achieved with the help of a visualization tool like Office Timeline that enables you to easily create and maintain professional-looking project visuals.
Check out our template library for more timeline templates, roadmap templates, and Gantt chart templates that you can easily customize to meet your project needs. Download the Office Timeline 14-day trial and start building stunning visuals that show the perfect level of complexity in the simplest form.
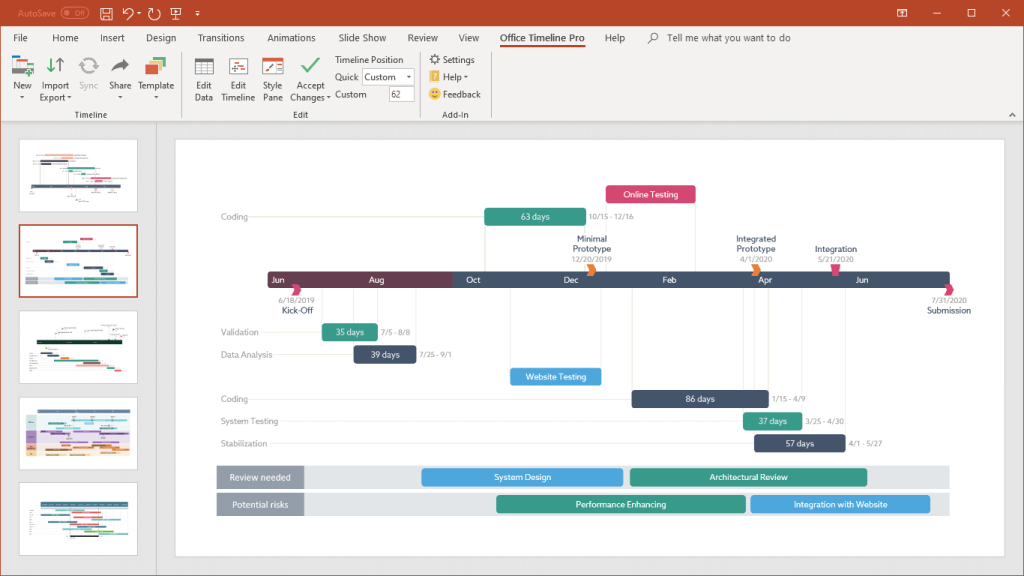
Turn project data into professional timelines
Get the advanced features of Office Timeline Pro+ free for 14 days.
Get free trial| If you want to get started quickly, check out this related post with the 3 best free templates for Pharmaceutical timelines. |