Discounted Cash Flow Analysis—Your Complete Guide
This complete guide to the discounted cash flow (DCF) method is broken down into small and simple steps to help you understand the main ideas.
We’ll walk you through what a discounted cash flow analysis is, what it is used for, as well as what all the distinct terms mean, and provide step-by-step instructions on how to calculate company value, and share price, using the DCF method.
If you want to read to a step-by-step example of a DCF, skip to the end of the article here.
If you want to understand the pro’s and con’s, skip down to here.
If you want to understand the basic logic first, keep reading.
What is the Discounted Cash Flow Method?
What is the discounted cash flow method? The discounted cash flow (DCF) method is one of the three main methods for calculating a company’s value. It’s also used for calculating a company’s share price, the value of investments, projects, and for budgeting. The DCF method takes the value of the company to be equal to all future cash flows of that business, discounted to a present value by using an appropriate discount rate. This is because of the time value of money principle, whereby future money is worth less than money today. That’s why it’s called a ‘discounted’ cash flow.
Context of DCF: There are three main approaches to calculating a company’s value. The first is 1. the intrinsic or income-based approach, also known as an entity approach, then there is also 2. the asset-based approach also known as the cost-based approach, and finally 3. the multiple based or ‘comps’ (comparable company analysis) approach. A DCF analysis is the main income-based approach—an approach based on the company’s own cash flows.
The DCF Formula
We’ll explain what all these terms mean, as well as the logic behind the method, below.
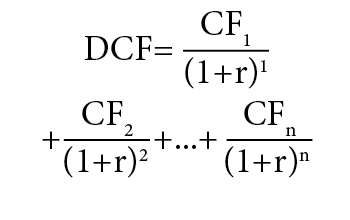
DCF = discounted cash flow
CF_i = cash flow period i
r = interest rate (or discount rate)
{n} = time in years before the future cash flow occurs
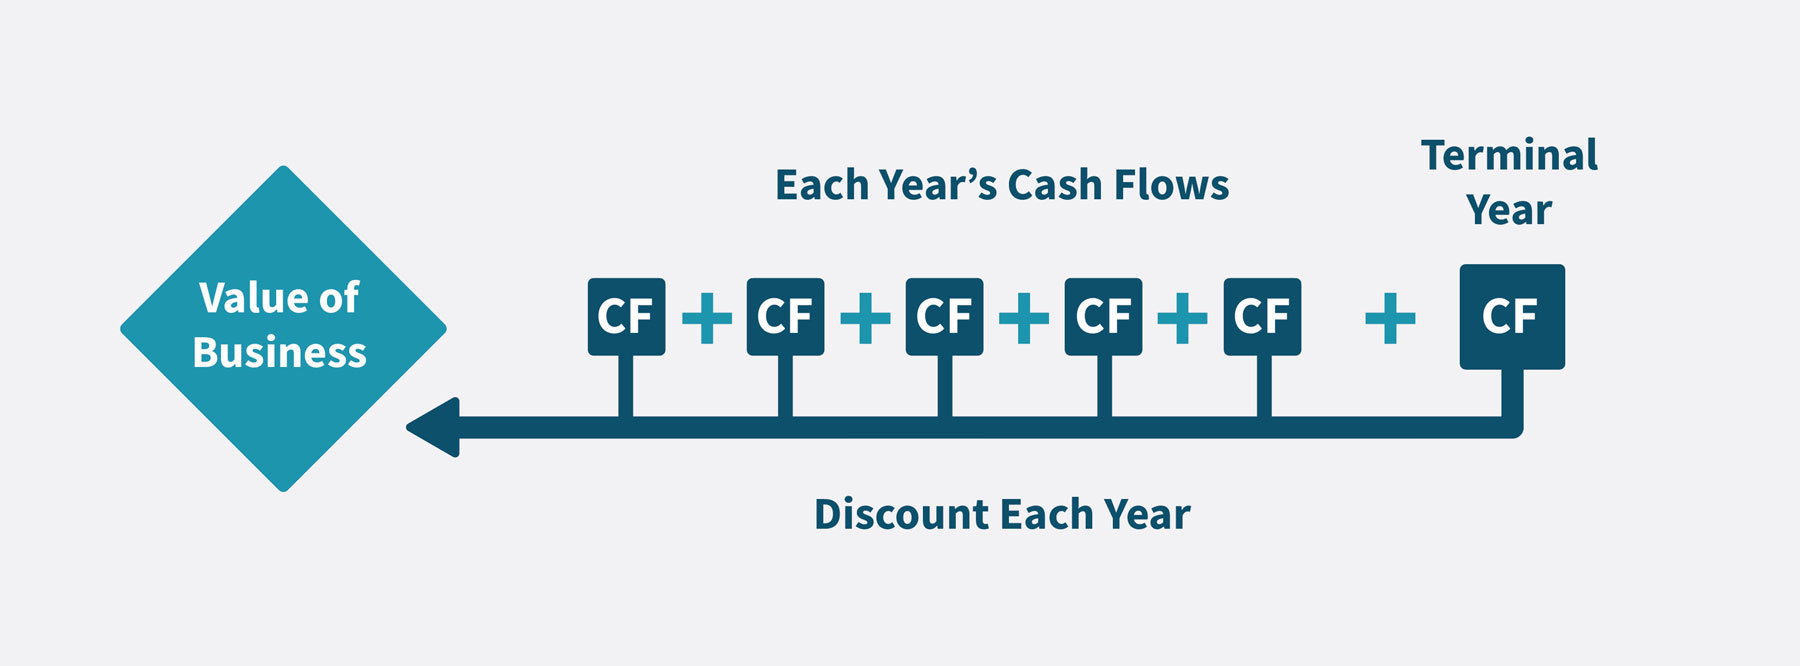
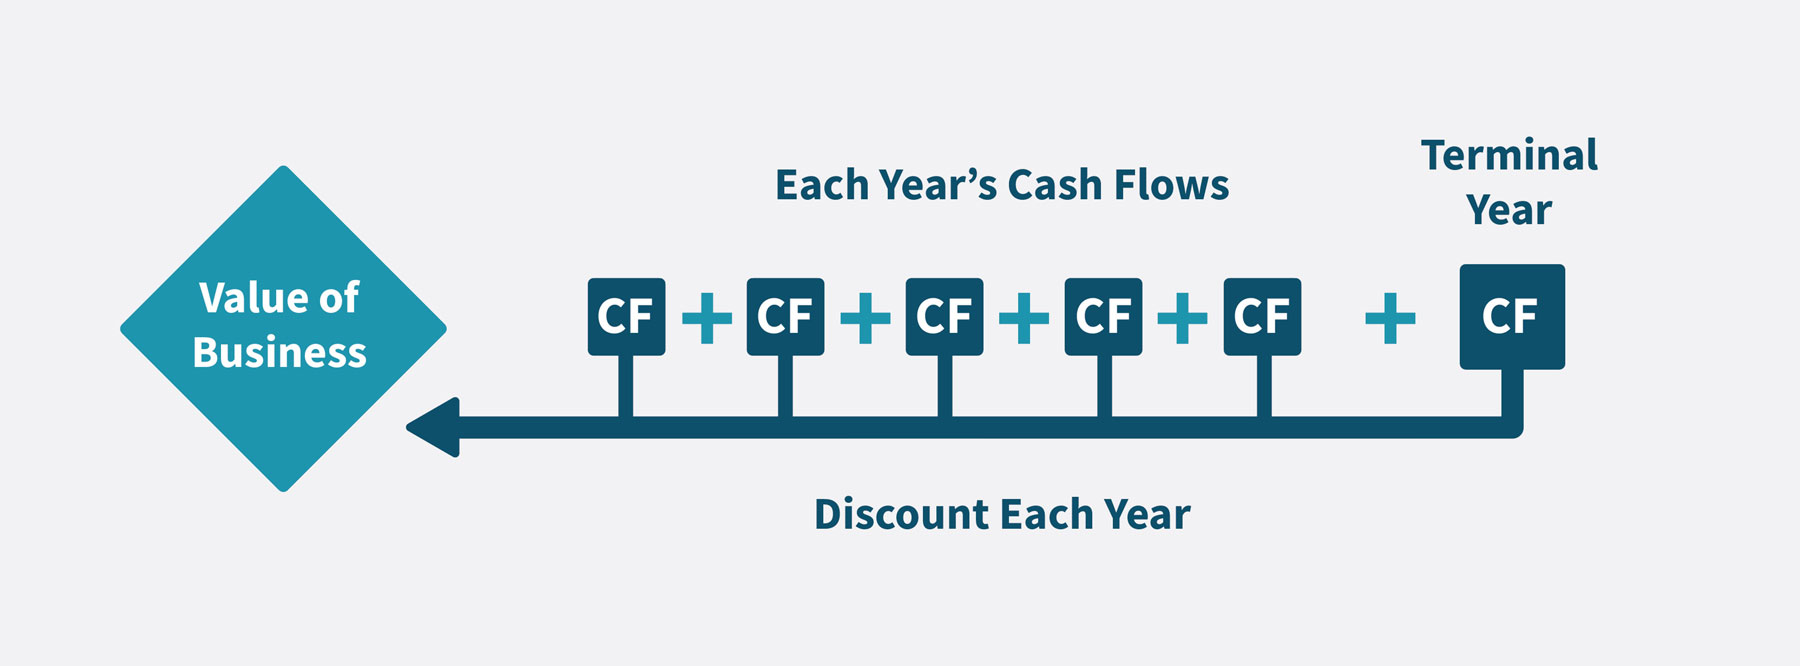
In essence, this equation simply adds up all future business cash flows, but discounts each one.
A discount rate, or discount ‘factor’, is calculated and applied to each year’s cash flow, in order to arrive at the present value.
Understanding the Logic Behind a DCF
Why is it Called ‘Discounted’ Cash Flow?
Let’s imagine you’re valuing a company that’s going to operate for 3 years and then stop operating.
How much is it worth?
You could say it’s worth whatever cash flows it produces, each year, for these 3 years.
Like this:
| Year | 1 | 2 | 3 |
| Cash Flow (CF) | $10 million | $10 million | $10 million |
$10 million + $10 million + $10 million.
No points for working out that this company is worth $30 million. But here’s the big problem with this basic approach:
Is that predicted $10 million of cash flow in the future, really equal to $10 million in your pocket today?
The answer is no, it’s not.
What’s worth more to you out of $10 today or $10 in three years’ time?
Your answer is probably the money right now, and so you can see money today is worth more than money in the future. This actually has a name—it’s called the Time Value of Money (TVM) principle, and there are several reasons for this to be the case:
Uncertainty—future money is not guaranteed.
Inflation—you will be able to buy less with that $10 in 3 years.
Investing—you can invest that $10 today, earn, say, 10% interest per year, and in 3 years it will be worth $13.31.
So, to be more accurate in using cash flows to value a business, you’re going to need to discount the money to be received in the future. In particular, reduce this figure of future cash flow, to bring it in line with what that amount of future money could be said to be worth today. Only at this point do you add up all the ‘discounted’ cash flows, to get your company value. It should now–we hope–be obvious why it’s called a discounted cash flow analysis.
Following the Fundamental Steps in a DCF
As just explained, in a DCF analysis, you discount the future cash flows in order to value a company more accurately.
So, by how much do you discount them? Well, by a certain discount factor. You then apply this discount factor to each year’s cash flow.
This discount factor is the main method underlying a DCF. Once you apply these discount factors, in essence, you then simply add all the years together–with the factors applied–to give you the value of the business.
The discount factor for each year is calculated as follows:
1 / (1 + r) ^ n
r = discount rate
n = number of discount years
Looking at it differently, this calculation provides you with a discount factor that tells you how much you’d have to invest today, in order to get to that figure of $10 million in year 1, $10 million in year 2, in year 3, and so on.
Remember, present money can earn interest and be worth more in the future. That is the fundamental principle underlying this method.
Adding A Row for the Discount Factor
Here we will add on a row in our table to illustrate.
You don’t need to worry exactly how the formula itself works too much to perform the method.
The important figure there is r, which we’re using as the discount rate in this whole equation. In the full DCF, it will often be the WACC, which we’ll come to later. But here, we use what interest we could get from an alternative investment in the market, called the Market Rate. This is the rate of return you’d get if you invested your money today instead.
In our example, it’s 10%.
With that r figure plugged into the above formula, you find the discount rate appropriate for each year, as so.
| Year | 1 | 2 | 3 |
| Cash Flow (CF) | $10 million | $10 million | $10 million |
| Discount Factor (using r=10%) | 0.9 | 0.83 | 0.75 |
Every year you discount it by a different factor. The further in the future, the more you discount it and thus the lower the discount factor.
Then you simply multiply the cash flow each year by this discount factor.
This provides you with your discounted cash flow figure.
You get:
| Year | 1 | 2 | 3 |
| Cash Flow (CF) | 10M | 10M | 10M |
| Discount Factor (using Market Rate: r=10%) | 0.9 | 0.83 | 0.75 |
| Discounted Cash Flow | $9 million | $8.3 million | $7.5 million |
Then if you add them all together, instead of getting $30 million… you get:
$9 million + $8.3 million + $7.5 million =
$24.8 million
This is quite a bit less than the original $30 million figure, so you can see the real impact of the TVM principle and its impact on the DCF approach right there. This value is widely referred to as the “Net Present Value” (NPV).
Congratulations, you have now seen, quite simply, the logic behind a discounted cash flow method. Does this make sense? We hope the underlying logic is fairly clear…
But, you may have spot something that’s not particularly realistic. Businesses often don’t stop operating after year 3. In fact, we don’t actually know how many years they’ll operate for. So, how do we account for the value of the cash flows across all these possible years in the future (which may be forever)?
Well, the short answer is after that forecast period where we estimate each year’s cash flows then discount them, we add a single number at the end to account for all the theoretical years in the future, called the Terminal Value (TV). We’ll explain how this works next.
But first, a quick aside, which you can feel free to skip if you want to jump ahead:
Why Do We Use the Market Rate to Calculate the Discount Factor?
The market rate of return on investing money today, tells us how much more that money will be worth in the future because it earns a return. We add that return on, and get a larger cash value in future years.
Working backwards from this larger value using the market rate can, conversely, tell us how much less money we would have losing, say, 10%, each year.
So, given an annual return of 10% on your invested money, to get $10 million by year 3, right now, in your hand today you’d need $7.5 million. This is because if you invested that today with 10% return every year, by year 3 you would have $10 million.
So, using this method, we can say that $10 million in year 3 is actually only worth $7.5 million today. That’s how much we’d need now to equal $10 million in year 3 (given that 10% market return rate on investing that money today).
This a major way that the ‘discount’ part in the discounted cash flow, gets done.
(Let’s pause here to acknowledge the big assumption that ‘interest rates will be 10% every year’. Obviously, this is an important assumption to try to predict accurately, as it has a sizeable impact on the valuation).
Explaining The Terminal Value
What happens after year 3 of our projected forecast?
How many years does the company last and what is the total and, more importantly, the Present Value, of these cash flows across these future years?
We need to know this sum total number so we can add it to the other three years of cash flows, to get the full value of the company’s entire life.
Well, the DCF method uses a number called the Terminal Value to represent this assumed sum total. This Terminal Value is the number the DCF method uses to represent what the business is worth beyond your initial 3, 5, 10-year (etc.) forecast. It’s a very important number in a DCF analysis because it represents a large chunk of the total valuation amount.
“How do I calculate the Terminal Value?” you may ask. Well, once more you can rely on a widely used formula.
FCFn x (1 + g) / (d – g)
And you need three numbers to do this.
- FCFn is the free cash flow in year n, being the last forecast period
- g is the terminal growth rate.
- d is the discount rate (which is usually the weighted average cost of capital (WACC), r in our previous example)
This formula is known as the Gordon Growth formula.
What Happens When We Add the Terminal Value?
Let’s do a quick example to illustrate the portion of the final valuation that is represented by the Terminal Value.
Let’s say the discount rate, using the WACC, is 12% (so, this is a risky business – the higher the WACC, the riskier the business as investors expect to be compensated for taking on additional risk).
The terminal growth rate is 1.7%.
(The growth rate always has to be lower than the growth rate of the economy, otherwise given enough time the company will grow larger than the economy, which doesn’t quite make sense).
If we plug these values into the above formula, this Terminal Value calculation gives $98.7 million. But remember—you still have to apply the discount factor at the end of the forecast period. Using the WACC of 12% in year 3 provides a discount factor of 0.75 which produces a Net Present Value of the Terminal Value of:
$74 million.
Can you remember how much our 3-year business was worth before this step? It was worth $24.8 million. So the Terminal Value here is three times as large!
Incidentally, adding them together gives the total value, which would then be $98.8 million. You can see why the Terminal Value is so important to the valuation as a whole!
Two Methods to Calculate the Terminal Value
As mentioned, the Terminal Value is highly important to a DCF valuation because it takes up a large chunk of the whole valuation.
There are two main methods to calculate what the business is worth after the years of your forecast cash flow. That is–of course–two ways to calculate the Terminal Value.
As it turns out, one major way is to assume the company will exist forever.
This is the perpetual growth method, also known as the Gordon Growth Method, which is the one used in the example immediately above and is particularly favored by academics.
The second approach is by assuming the business is sold at that point.
This approach then becomes technically a multiple-based approach, because of the way it works. Practitioners assume the business is sold as a multiple of some financial metric like EBITDA, based on what they can see today for other businesses that were sold, and what these comparable trading multiples are.
Some practitioners will use an average of both methods.
How to Determine the Correct Discount Rate to use?
In this article, we have referred to the discount rate to be used to discount the future cash flows as the Market Rate (r) or generally as the discount rate (d).
The principle behind determining the correct discount rate to use is that the discount rate needs to adequately reflect the riskiness of the business being valued.
In most DCF analysis, practitioners make use of the Capital Asset Pricing Model (CAPM) to calculate a discount rate that reflects the riskiness of the business being valued. The details of how the CAPM works is beyond the scope of this article but in short, the formula is as follows:
Ce = Rf + B x (Rm – Rf) + Cp
Ce = Cost of Equity
Rf = Risk-free Rate
B = Beta
(Rm – Rf) = Equity Market Risk Premium
Cp = Cost of Equity Premium
If the WACC is used to discount the cash flows (more on this below), then it is calculated as follows:
WACC = Ce x [E/(D+E)] + Cd x (1-t) x [D/(D+E)]
Ce = Cost of Equity
E = Equity
D = Debt
Cd = Cost of Debt
t = Tax Rate
How to Value Stocks Using DCF?
Valuing stocks using DCF is pretty much the same method when valuing a company but you just take one extra step.
Once you have added all your future discounted cash flows together, you get the value of the business today. Then you simply divide this figure by the number of shares. So if we take our example from before and we know they’ve issued 10,000,000 shares. We divide the value of the company by 10,000,000, so we get $9.88 per share. This gives us our own unique determination of what the share price should be.
The 5 Major Steps to Calculate a DCF
Really, conducting a DCF is just like following a recipe.
There are some simple steps to take, and these are often done in MS Excel. Or, if you have a tool like Valutico, then you just need to enter some key figures and the software does all the work.
But if you want to be able to go through the steps yourself, let’s do that now.
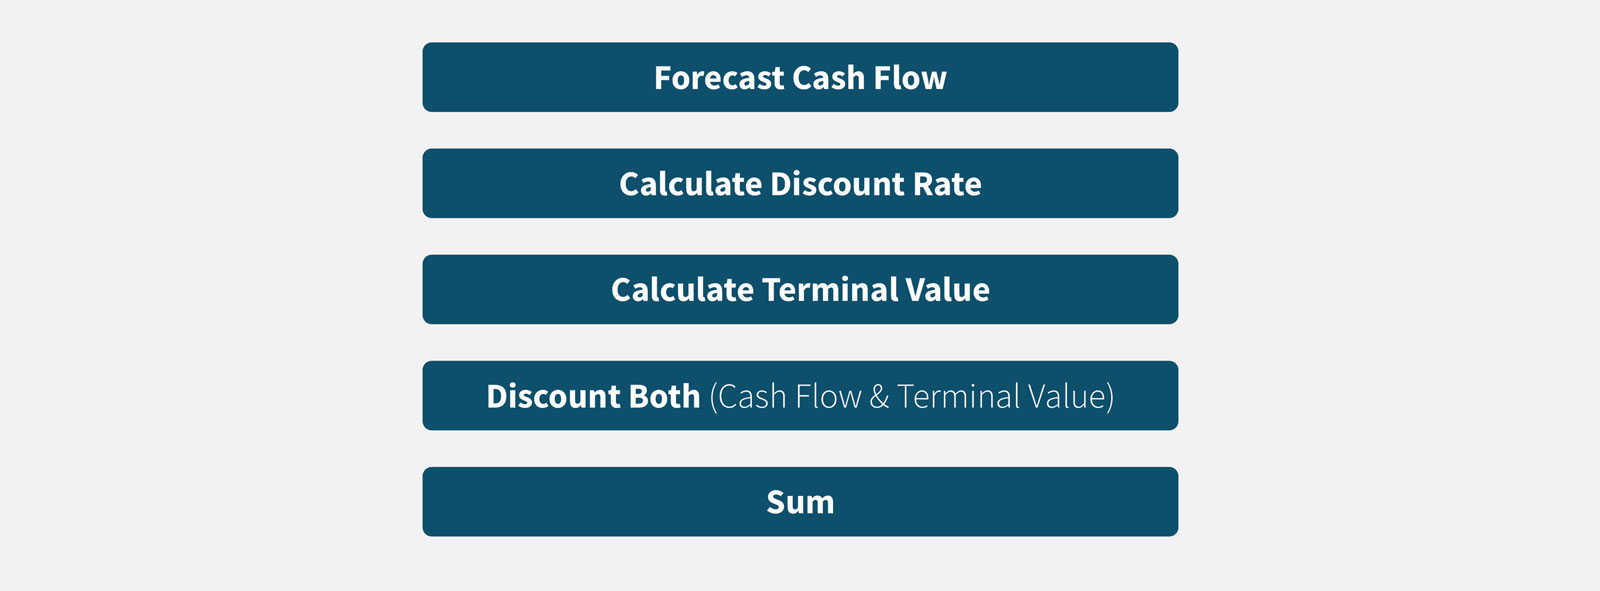
Here is a recommended order of steps to follow:
Step 1. Forecast cash flow. (‘free cash flow’)
Step 2. Calculate the discount rate. Often, the Weighted Average Cost of Capital (WACC) is used*.
Step 3. Calculate the Terminal Value.
Step 4. Discount the cash flow. Discount the Terminal Value.
Step 5. Add up all the figures you have to arrive at the Net Present Value. Depending on the exact methodology and discount rate used, this could be the Enterprise Value or Equity Value.
*the WACC is one popular discounted cash flow method (DCF WACC). However there are other methods.
Why Would You Use a DCF Model?
DCF is widely used in valuing companies, and it is used widely in valuing stocks as well. But it can be used in several ways, including to:
- Value a business you want to sell, or for a business you want to purchase.
- Value a company’s stock price to compare it to the actual stock price, as one piece of information to help you decide whether to invest.
- Value a project.
- Assess the impact of an initiative, like a cost-saving programme or entering a new market.
- Use for internal financial planning and accounting (FP&A) purposes, such as budgeting, and forecasting.
- Allow a company to raise money.
Problems with a Discounted Cash Flow Analysis
No approach to valuing a company or stocks is completely perfect.
Just remember, when valuing you are making educated guesses about the future.
If you get these educated guesses wildly incorrect, then your valuation will likely also be off.
But let’s take a closer look at some of the drawbacks specific to the DCF approach.
Garbage in. Garbage out.
Cash flow: A lot hinges on getting these cash flow projections correct. It might be quite straightforward to project cash flow for year 1, but when you get to year 2, and especially years 3, 4, 5 and beyond, in many industries this becomes almost impossible to predict with a high degree of certainty. Some industries like oil and gas might lend themselves to you having a longer forecast period of say 10 years, but even these industries are subject to the unknown future. When you’re trying to predict cash flow for many businesses in 5 years’ time it can be particularly difficult, and becomes closer to complete guess-work.
Moreover, year 4 cash flows are determined by year 3 cash flows, as that is the way the business works. Year 5 by the year before, and so on. If you make a mistake in the early years, this deviation can be magnified in the future. Small variations early on are magnified later.
Strengths of a Discounted Cash Flow Analysis
The DCF approach is widely used and considered a strong approach for valuing a company or stocks. Many would call it the leading approach. Here are some of the main reasons:
- It is a so-called ‘intrinsic’ approach based on data that directly reflects the company’s actual financial performance.
- It allows the practitioner to consider multiple distinct financial performance scenarios, whereby they can compare different possible futures based on making different assumptions.
- Relying on cash flow data, it incorporates a wide range of important financial metrics, such as net income, working capital, and capital expenditure.
What are the Different DCF Methods?
This article has outlined the simple form of a DCF analysis. However, there are multiple versions that differ in how they are calculated and when they should be applied:
- DCF WACC (simplified)—largely what this article has been describing, your basic DCF which calculates Free Cash Flow to the Firm and discounts these cash flows using the WACC as the discount whilst keeping a constant capital structure (D/E ratio) throughout the forecast period.
- DCF WACC—similar to the above except that it calculates a different WACC in each forecast period based on a changing capital structure (D/E) and thus a changing beta in each period.
- Flow to Equity – this calculates the Free Cash Flow to Equity and discounts these cash flows using the Cost of Equity.
Note that in theory the above three approaches should deliver an identical valuation result thus the choice of what method to use is simply down to the level of information at hand and personal preference.
A DCF Example – Each Step in a DCF Calculation in Order
In practice, you can calculate a DCF using MS Excel. However, if you do multiple valuations throughout the year, or valuations you want to update regularly, then a tool like Valutico makes things significantly easier.
To understand the steps, let’s go through each in turn with our DCF example.
Step 1. Cash Flow
You need the ‘unlevered’ cash flow*. To calculate this free cash flow (FCF), you need to add up the following figures (you do not add the tax rate, that is shown below as it’s used to calculate the tax amount).
| EBIT | 5,000 |
| Tax Rate | 25% |
| Tax (from tax rate and EBIT) | -1250 |
| Depreciation | 100 |
| Amortization | 225 |
| CapEx | -1,550 |
| Non-cash working capital | -180 |
| FCF | 2,345 |
The CapEx, tax, and in this case non-cash working capital, are negative.
Add these to get the free cash flow for that single year (or particular period, like 6 months). Step 1 done.
*You can also do a different ‘levered’ cash flow method (Free Cash Flow to Equity), which ‚in theory‘ at least should provide the same outcome, but unlevered is the more commonly used. Unlevered is the operating cash flows (Free Cash Flow To Firm), whereas levered is the cash flows available to shareholders once other claims (i.e. debt) has been paid.
Step 2. Discount Rate
Now, we need to calculate the discount rate. We will use the CoE and WACC formulas described above. Therefore, we can put in the following values:
| Equity | 17,500 |
| Debt | 15,000 |
| Cost of Debt | 5% |
| Tax rate | 25% |
| Risk free rate (can use 10y Treasury) | 1.5% |
| Beta | 1.3 |
| Market Return | 10% |
| Cost of Equity | 12.55% |
We had to calculate the Cost of Equity using the CAPM method as previously described. Now, we’ve got that, we can move onto two core components of the WACC equation, to finally give the WACC.
This is:
| Debt / Debt + Equity | 46.15% |
| Equity / Debt + Equity | 53.85% |
| WACC | 8.49% |
Finally, we have our discount rate.
Step 3. Terminal Value.
Now, we need the Terminal Value.
There are two methods, and one option is to combine them both and use the average.
First, the perpetuity growth method (or Gordon Growth model).
And then, the exit multiple.
The perpetuity growth formula is:
Free Cash Flow on last year + 1 / (discount rate – growth rate)
So we need:
| WACC | 8.49% |
| Growth Rate | 1.70% |
| EV/EBITDA Multiple | 7 |
The WACC we need because it’s our discount rate in this equation.
But we also need the free cash flow from the last year.
So here is the EBITDA and FCF year on year for our entire 5-year forecast period:
| Period | 1 | 2 | 3 | 4 | 5 |
| EBITDA | 5,325 | 5,530 | 5,730 | 5,820 | 5,820 |
| FCF | 2,345 | 2,510 | 2,720 | 2,795 | 2,800 |
Then taking these we get the following:
| TERMINAL VALUE | |
| EBITDA | 5,820 |
| Exit Multiple (EV/EBITDA) | 40,740 |
| Perpetuity Growth | 41,948 |
| Average | 41,344 |
Step 4. Putting it all together.
Now that we have the WACC and the Terminal Value, we can do the discounting.
Both the free cash flows, and the Terminal Value need to be discounted.
Then we sum these, and get the Enterprise value (EV).
Let’s go.
Remember, the discount factor equation is:
Discount factor = 1 / (1 + r)^n
In this case, we have chosen to use WACC for r.
So we get the following:
| Period | 1 | 2 | 3 | 4 | 5 | |
| FCF | 2,345 | 2,510 | 2,720 | 2,795 | 2,800 | |
| Terminal Value | 41,344 | |||||
| Discount Factor | 0.92 | 0.85 | 0.78 | 0.72 | 0.67 | |
| PV of FCF | 2,162 | 2,133 | 2,130 | 2,018 | 1,863 | |
| PV of TV | 27,510 | |||||
| Enterprise Value | 37,815 |
And this enterprise value is the value of the business.
Congratulations, if you worked along, you have now valued a business using the DCF method.
If you perform multiple valuations per year, and valuations are a significant part of the work you do, then using a tool that automates most of the process can make your life much easier. Try booking a demo, if this applies to you. Otherwise, we hope the explanation above has helped you wrap your head around what a DCF analysis is, and how to use one.

