The manufacturing industry has seen major disruptions recently due to the Covid-19 pandemic and international conflicts, leading to a global shortage of raw materials and sky-high energy costs.
While the domino effect of these issues ripples through the entire sector, challenges such as labor shortage, supply chain bottlenecks, and shipping delays are expected to last into the years to come.
Along with the constant pressure of digitalization and carbon neutrality, the manufacturing industry is faced with the critical task of shifting gears to overcome obstacles and meet increased demand.
As a consequence, manufacturing companies are forced to shift their business strategies to be able to streamline their processes and manage products and portfolios more efficiently.
This transition from business-as-usual calls for easy-to-understand, actionable product roadmaps, lifecycle timelines, and production process plans that project/product managers can build, present, and update with minimal effort.
To help you out with your product planning, development, and analysis initiatives, we’ve designed 3 ready-to-customize examples of Gantt charts, timelines, and roadmaps. You can download any of these PowerPoint slides for free and adjust them based on your project requirements using the Office Timeline free trial.
1. Timeline of manufacturing steps
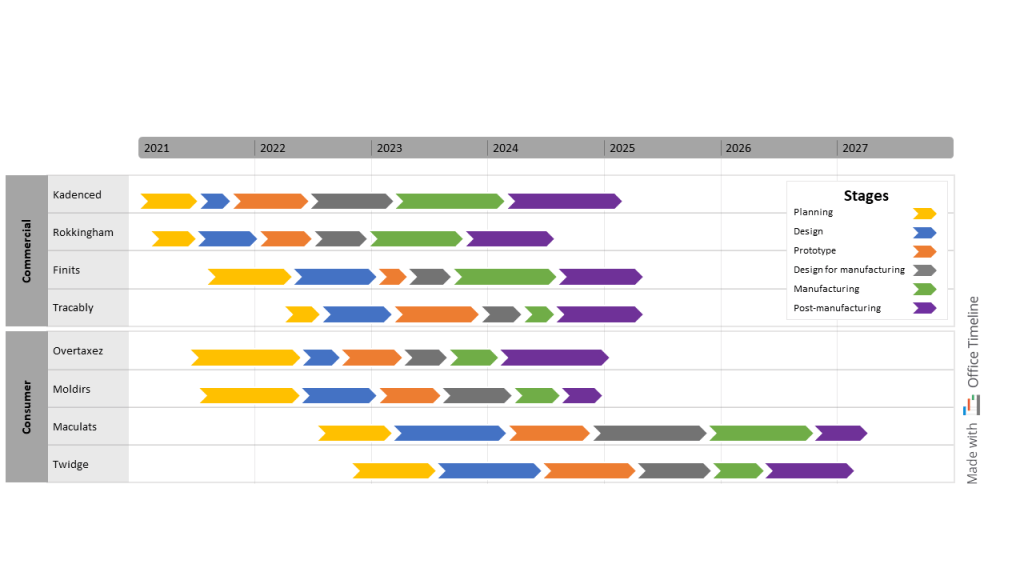
Gloria is a Portfolio Manager at a large manufacturing company, where she tracks each step of the manufacturing process for their current and future products. She’s almost halfway through creating a timeline of the manufacturing stages across the entire product portfolio. Once done, she’s going to use the visual to focus the audience’s attention in her upcoming executive meetings.
If you had met Gloria three months ago, you’d have most likely seen her frowning at her laptop screen and constantly mumbling under her breath while struggling to manually create a timeline in PowerPoint with the data from her Excel spreadsheets. Thankfully, one of her coworkers had noticed her ongoing frustration with these tools and recommended she try Office Timeline, a PowerPoint add-in for project visuals.
Ever since testing the new app, putting together a high-level timeline has gone smoothly — no more wasted hours trying to get the design to look presentable. Within minutes, Gloria imported the data from Excel and started customizing the look of the timeline.
After creating a swimlane for each product category (consumer and commercial) and dividing these into sub-swimlanes for all the products included in the company’s portfolio, she mapped the main steps of the manufacturing process in sequence from left to right.
Gloria wanted her visual to stay uncluttered, so she used the Timeline View to align the same steps on a single row, thus saving space on the slide.
She also made sure that every manufacturing stage had a specific color assigned to them to maintain consistency across product types: manufacturing would always be green, prototyping orange, and the design phase blue. Using PowerPoint’s standard objects, Gloria included a legend to clearly show what each color meant.
The finished timeline is simple yet elegant, helping Gloria quickly update executives on what products have a prototype and which ones are already in the mass production phase. Moreover, she can spot bottlenecks on time and deal with them accordingly before they impact the company’s bottom line.
2. Site production roadmap
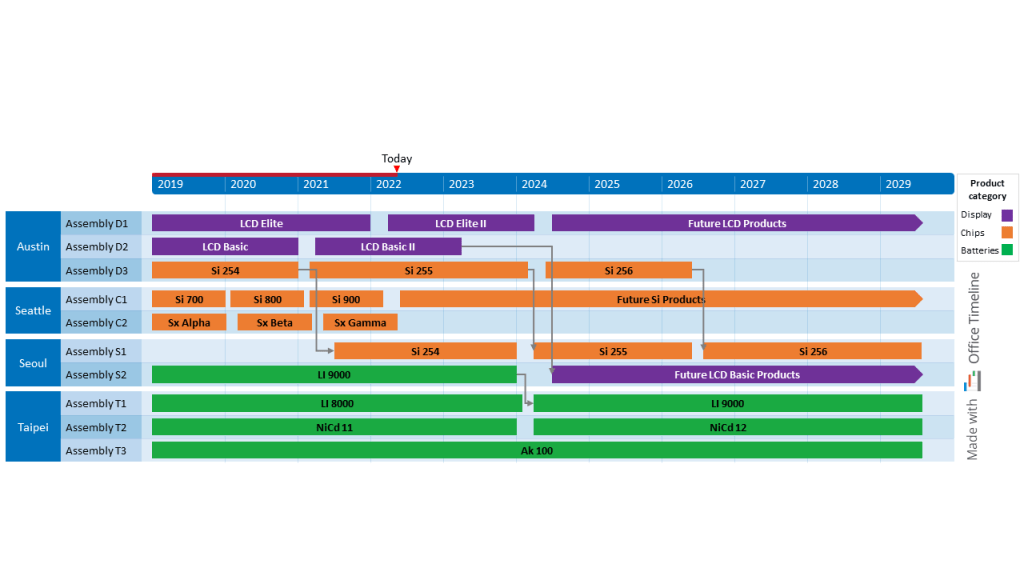
Chris is a Manufacturing Manager for a well-known electronic goods company, overseeing a diverse and evolving line of consumer electronics products. One of his most recent projects involves shifting outsourcing from domestic production sites to global ones for a couple of their primary assets. This strategy will allow the organization to tap into new talent pools, minimize manufacturing costs, and gain a competitive edge within its niche.
However, to ensure the company’s value chain leverages the operational efficiencies of global outsourcing without any disruptions, Chris needs to design a roadmap illustrating how the change in production processes will unfold. He chooses Office Timeline as he already had the chance to see how intuitive and hassle-free this roadmap maker is when creating professional-looking visuals for previous projects.
Within the Data View, Chris adds the manufacturing activities into sub-swimlanes by assembly lines, highlighting the allocation of the manufacturing assets. Then he groups the assembly lines into swimlanes based on the manufacturing site to show the concurrent activities in each plant or division.
He also selects three contrasting colors to distinguish between different product manufacturing activities, each color being assigned to a specific product category, as shown in the legend.
When it comes to illustrating the movement of manufacturing activities from one plant to another, Chris keeps it simple. A few PowerPoint connectors effectively placed are enough to pinpoint which established products are going to be outsourced overseas and what cutting-edge products will continue to be manufactured locally. Plus, the Today marker he placed on the timeband serves as a point of reference that reminds the upper management of the progress made up until that date and indicates what comes next.
With each project visual he builds in Office Timeline, Chris is convinced that delivering data in an organized, easy-to-understand format has to be every manager’s dream. Especially in the case of critical business choices such as outsourcing manufacturing processes, roadmaps like the one he created provide improved clarity into the long-term impact of that decision.
3. Quarterly Lean Manufacturing roadmap
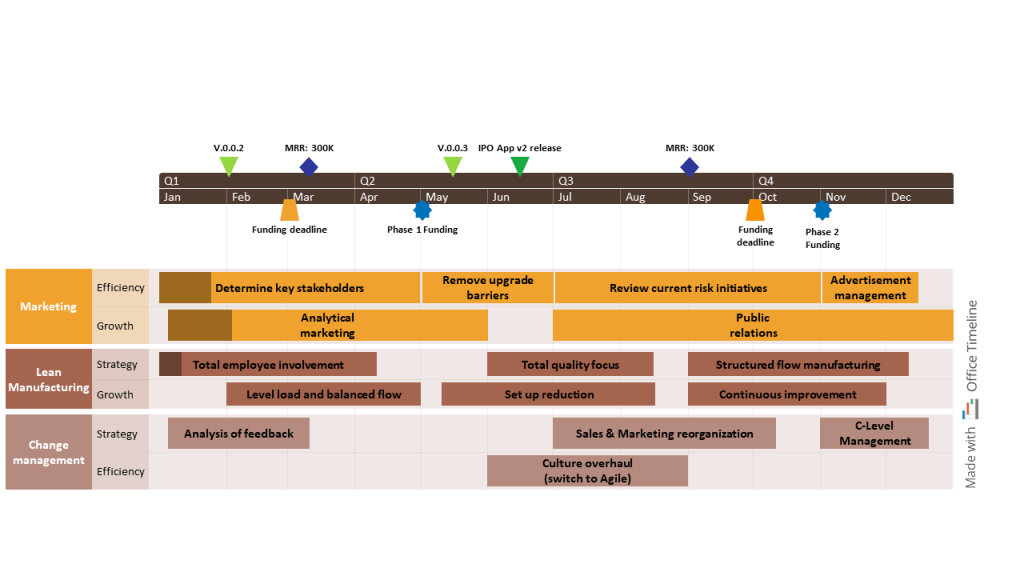
As a Lean Manufacturing Specialist, Mike has full ownership over the success and continuous improvement initiatives of an equipment area that spans different departments. His job is to assist the organization in implementing lean manufacturing principles and strategies and optimize the production process flow for better productivity.
Mike is well-aware that he has to demonstrate leadership and change management skills in order to sustain buy-in on his action plan. So he decides to create a one-year roadmap of the Lean Manufacturing process to present to his managers during performance review meetings.
While he used to spend hours making these visuals in Visio, now Mike turns to Office Timeline every time he needs an eye-catching roadmap or timeline to impress his audience. The main reason for that is that this new tool saves him loads of time not only when creating the visuals but also when updating them each subsequent quarter.
For this roadmap, Mike starts from scratch by customizing the timeband and adding key milestones related to funding and version releases. Next, he lists all the initiatives and groups them into departments (swimlanes) and business areas (sub-swimlanes). Then he selects the percent complete feature to show how things are progressing towards the set goals.
The finishing touches are added in the Style Pane, where Mike personalizes the roadmap using the brand’s colors to enhance the visual impact of his PowerPoint slide. As one would expect, Mike’s roadmap became the talk of the company when he first presented it. But, most importantly, the visual earned him the respect and trust of his executive managers, vital elements in a lean transformation process.
Visualize your project plans and gain stakeholder buy-in with Office Timeline
Manufacturing managers that understand and leverage the power of data visualization will be able to weather the challenges of the post-COVID world more easily and help their companies bounce back on time to handle increasing customer demand. If you enjoyed the visuals in this article, we invite you to have a look at the beautiful collection of timeline templates, roadmap templates, and Gantt chart templates on our website. Customize your favorite template or start from scratch with the Office Timeline 14-day trial.
Turn project data into professional timelines
Get the advanced features of Office Timeline Pro+ free for 14 days.
Get free trial