How to make swimlane diagrams with your usual office tools
Learn how to build effective swimlane flowcharts using your favorite office software.

Using swimlane diagrams to improve process flows
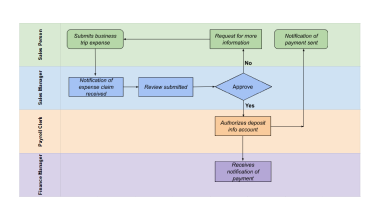
Professionals who want to document any business process model or add an extra layer of clarity to process mapping can do so by creating a swimlane diagram. Placing activities within horizontal or vertical swim lanes associated with relevant parties involved in the process, this type of flowchart increases accountability and provides support for process improvement.
For those who are not familiar with using dedicated swimlane diagram software to build process charts or activity diagrams, we have put together a series of resources and tutorials to help you achieve this goal. Get started faster and learn how to make process flow diagrams using the following productivity tools:
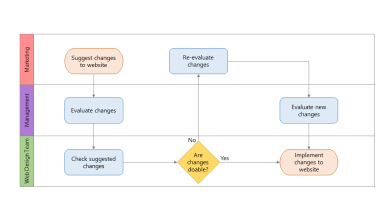
How to make a swimlane diagram in Microsoft PowerPoint
Widely used in organizations of all types as the main tool for showcasing data in a digestible format, PowerPoint can help business professionals create clear, actionable process flowcharts as well. To see how you can effectively map out processes and activities in the popular presentation platform, explore a step-by-step tutorial on how to build PowerPoint swimlane diagrams both manually and automatically.
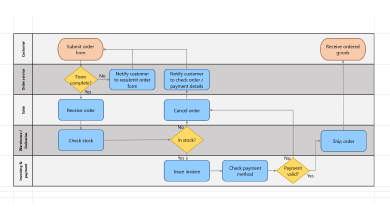
How to make a swimlane diagram in Microsoft Excel
If Microsoft Excel is your software of choice in organizing data, you can use the spreadsheet platform’s Shapes option to visually represent process steps in a table which can be then formatted into a basic swimlane flowchart. Check out our detailed tutorial to learn all about creating Excel swimlane diagrams, and also how to automate the process using a dedicated swimlane diagram maker.
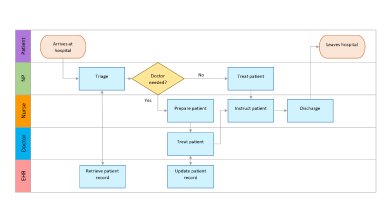
How to make a swimlane diagram in Microsoft Word
Used mainly for text editing purposes, Microsoft Word also includes some simple drawing features which can help users make a basic swimlane diagram to depict cross-functional processes. This well-structured tutorial lays down the steps of building such a visual in Word using the tool’s drawing canvas, along with alternatives ways to create a flowchart with a more suitable swimlane diagram creator.
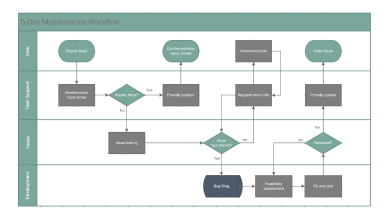
How to make a swimlane diagram in Microsoft Visio
Microsoft Visio is a diagramming and vector graphics application that allows you to dynamically visualize data-connected business process flows through a host of integrated features and pre-made starter templates. Although a powerful solution for creating swimlane diagrams, the tool is not included in Microsoft’s Office suite but sold as a stand-alone product. See how you can use it to generate a flowchart, but also to discover an easier, free alternative that yields visuals just as impactful.
How to make a swimlane diagram online
Professionals who need to easily share process flowcharts for improved execution and enhanced collaboration between cross-functional teams can use Google Sheets to create swimlane diagrams online. Although it doesn’t have a built-in diagramming feature, the online platform does allow you to illustrate a process flow through the use of its drawing tools and Shapes option. Get a comprehensive overview of all the steps involved with our present guide which also presents an alternative web-based swimlane diagram maker to automate the process.
FAQs about making swimlane diagrams
Here are the most frequently asked questions about making swimlane diagrams and their answers in short.
What are the main elements of a swim lane diagram?
A swimlane diagram diagram (also known as cross-functional or Rummler-Brache diagram) uses swimlanes and other standard symbols to pinpoint who is accountable for what parts of a process. Allocating specific tasks to major participants and illustrating how these different agents interact to complete the process, swimlane diagrams provide an easy-to-read map of responsibilities in that given framework.
Used to represent various process steps, the standard shapes and symbols that can be found in the structure of a typical swimlane diagram are:
- Rectangles with rounded corners for start/end points;
- Diamond for decisions;
- Regular rectangles for activities/tasks;
- Parallelograms for data input/output items;
- Rectangle with wavy line at the bottom side for documents;
- Arrows – to show how process steps are interconnected.
How do you create a swimlane diagram?
To create the outline of a swimlane diagram, you need to do the following:
- Identify the overall goal you want to achieve and the process that will lead to it.
- Break down the work into separate actionable steps.
- Define the major components of your process (these can be process stages or step owners).
- Delineate individual horizontal or vertical swimlanes for each of your process components.
- Use shapes to graphically represent process activities/tasks and group them by owner into their corresponding swimlane.
What is the best tool for swimlane diagrams?
Finding the best swimlane diagram tool for you directly depends on how complex your process is and how much level of detail and visual appeal you want your graphic to have. If you aim for simple swimlane flowcharts that can be produced with minimum effort, using a pre-formatted swimlane diagram template is the easiest, most effective way to go about it. If you need to generate a more professional output, then opting for a purpose-built swimlane diagram maker is recommended. Such type of software usually offers specialized integrated features and templates that help you automate the process and obtain a highly customized visual as a result.
One such diagramming tool is Office Timeline, a lightweight yet powerful PowerPoint add-in that helps you build stunning swimlane diagrams directly in the presentation platform.
Start diagramming now
Use our free PowerPoint add-in to create amazing project visuals with swimlanes in just a few clicks.
